
Everything Arkose Titan detects and decides, in your own console.
See which agents are on your flows and what each one is doing. Set the policy for every step of your customer journey. Show your team and your leadership what happened, and why. One console, no request filed.
One live view across sign-up, login and everything after.
Command Center is where both pillars of Arkose Titan, Agent Trust and Orchestration and Fraud Prevention, come together. Your team gets one view of activity across sign-up, sign-in and in-platform events: which AI agents are on your flows, which population each session belongs to, what each one is doing, and every fraud decision alongside. From the same screen they investigate what they find and act on it.
agent populations: self-disclosing good, non-disclosing good, malicious
industry journey templates, ready to edit
dashboard widgets, exportable to PNG, SVG or PDF
The state of your traffic, in a paragraph, with the data behind every line.
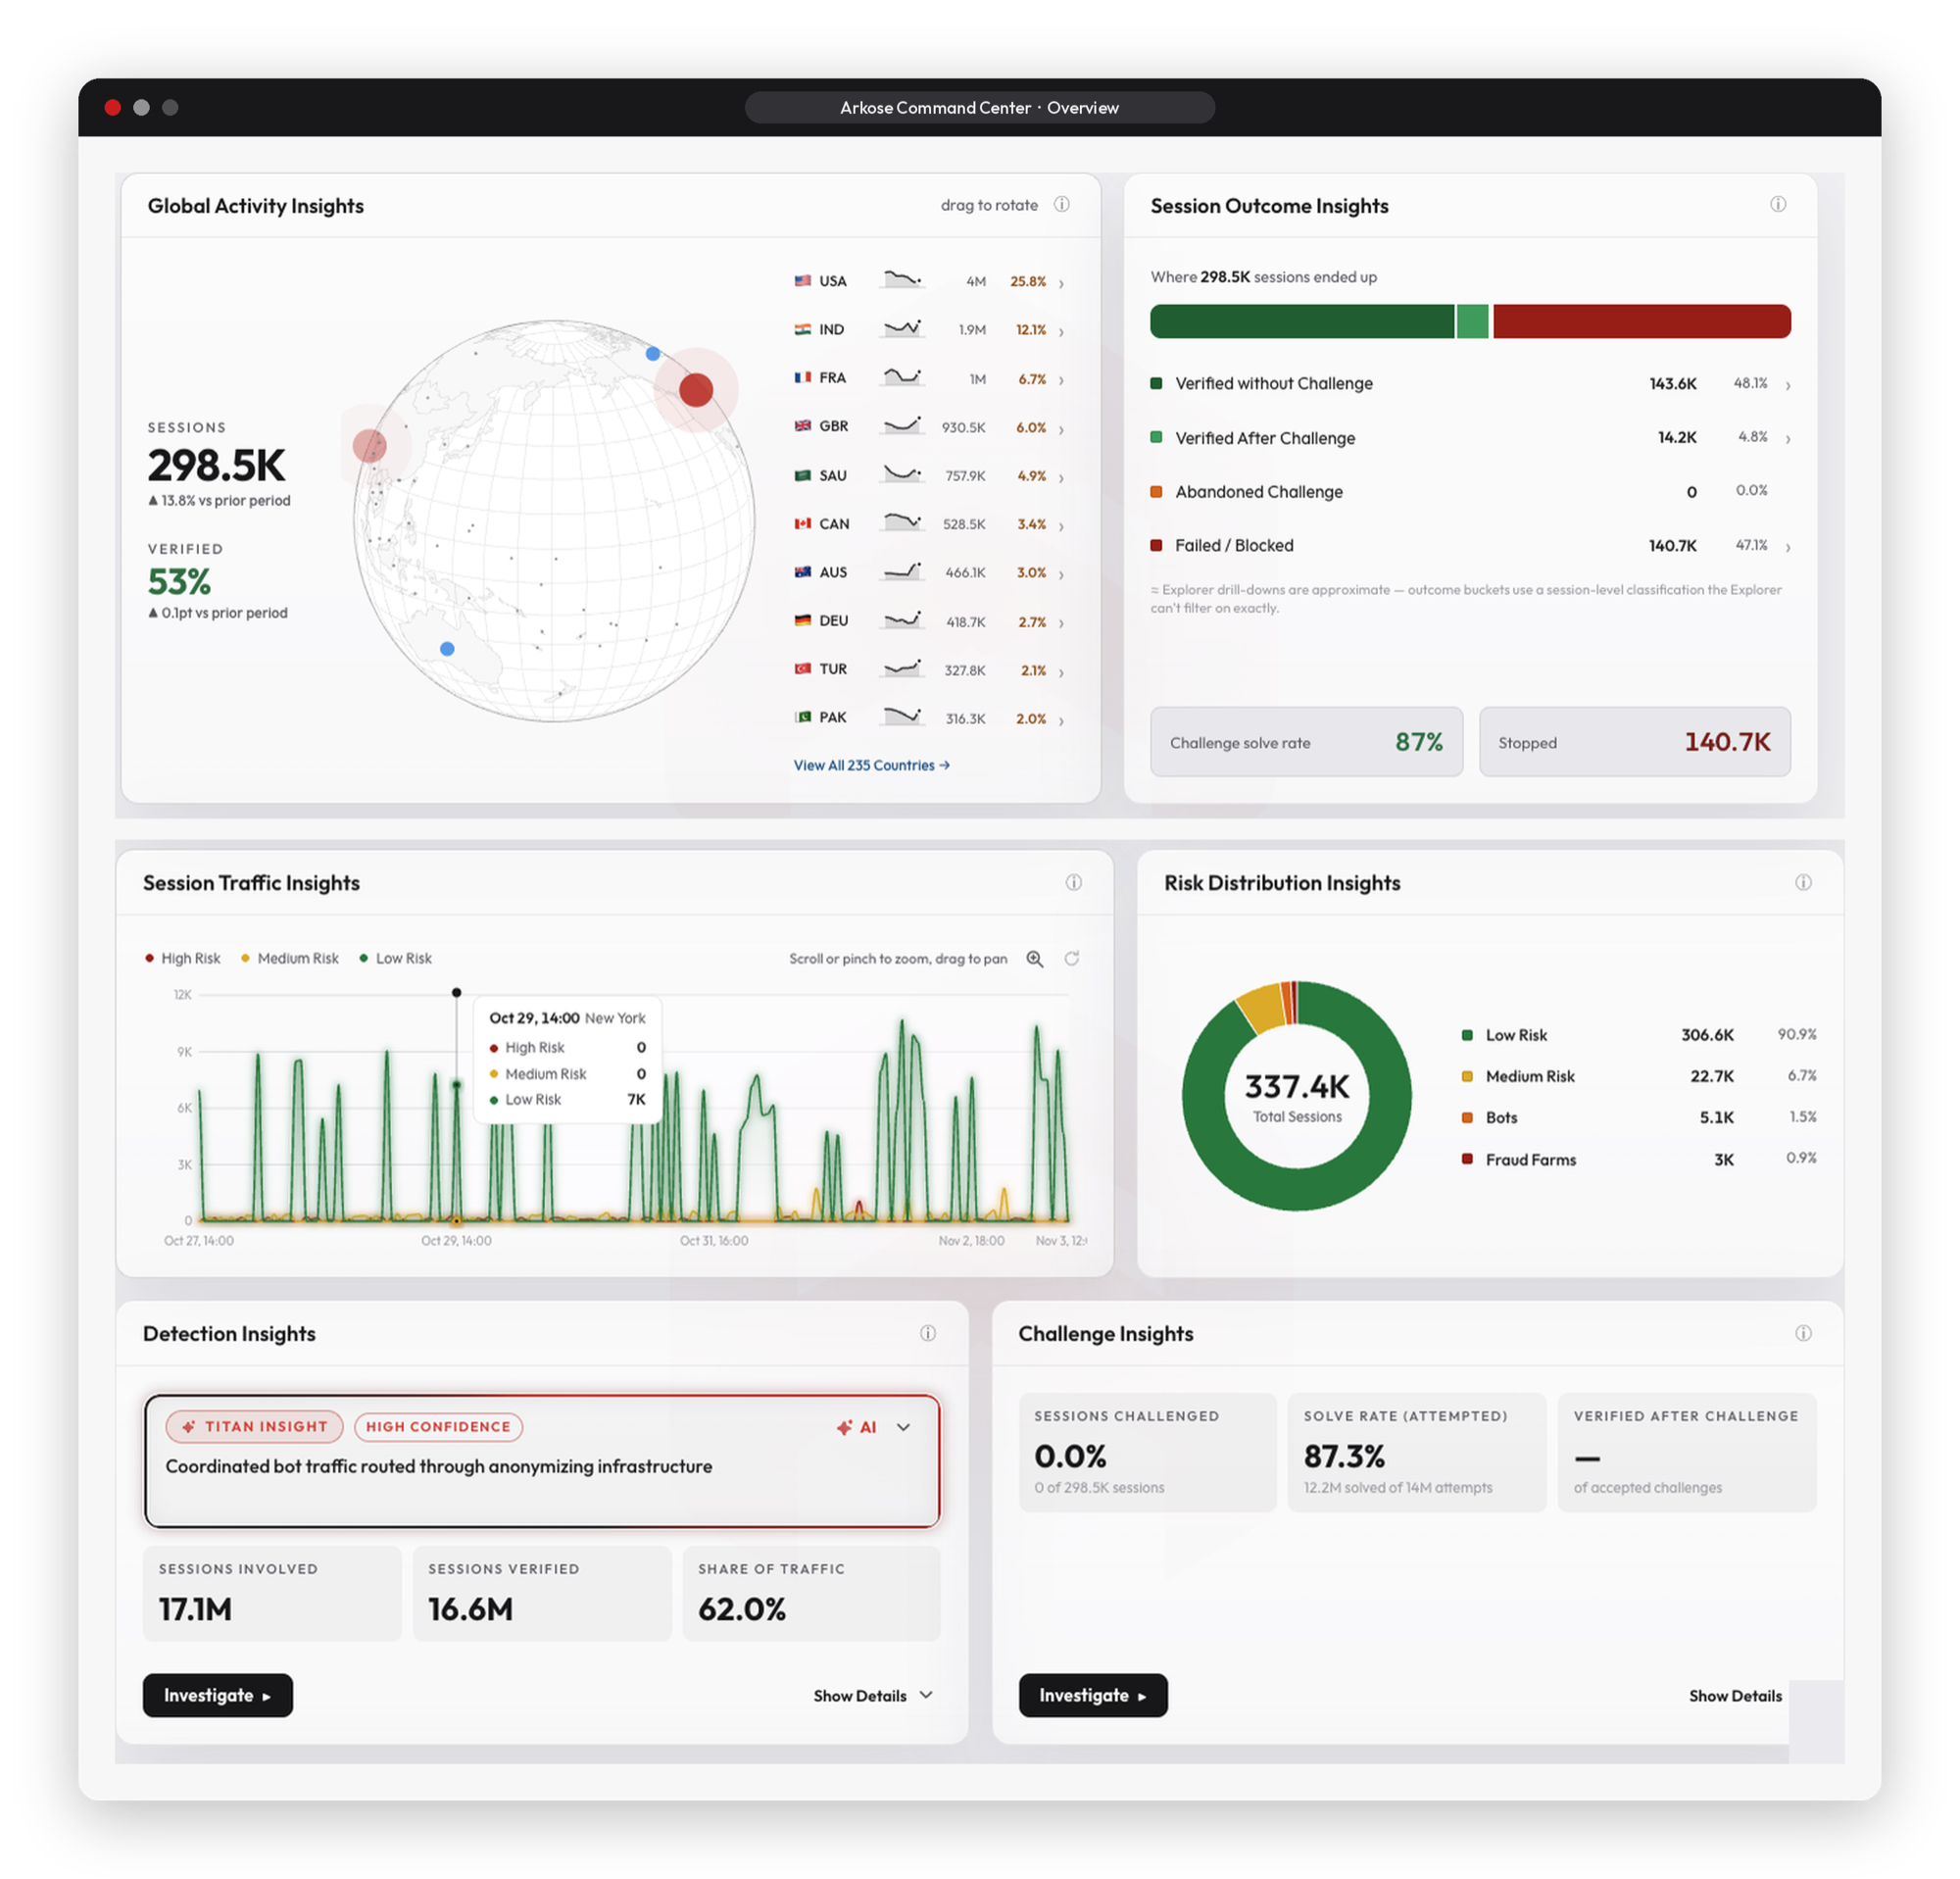
The Overview is home. Titan writes your weekly traffic summary in plain language and flags what changed; click any figure to open the sessions behind it. Alongside it, on one screen: Global Activity, Session Outcomes, Detection Insights and Challenge Health. If you are under attack, the banner at the top shows live and resolved alerts with severity and mitigation, one click from the sessions.
Titan weekly summary
The week in a paragraph, every line backed by data. Ask Titan for the follow-up question.
Session Outcomes
Sessions, threats stopped and the share verified without a challenge, the Fraud Prevention pillar at a glance.
Am I under attack
Live and resolved alerts with severity and mitigation, and a one-click path to the sessions behind them.
Set the policy. Titan applies it while the interaction happens.
In Orchestrate, lay your customer journey out as steps: sign-up, login, checkout, account changes, money movement. Pick the template that fits your business, then choose a policy for each step and each population: allow, monitor or block. Start in “monitor” to see what a policy would stop before you enforce it. When your policy blocks a known agent, it sees a clear message in your brand that this workflow is not supported for agents, and the message can point it to the path you do support.
- Ten industry journey templates ship by default and can be edited.
- Allow, monitor or block, per step and per population. Let self-disclosing good agents browse, monitor non-disclosing good agents at sign-up and login, block malicious agents everywhere, and block every agent at the steps that move money or change credentials.
- Monitor first: run a policy to see what it would stop before you enforce it.
- Your policy on a journey map your whole team can read. Change it any time, with no code changes.

Know every agent on your flows, and what kind it is.
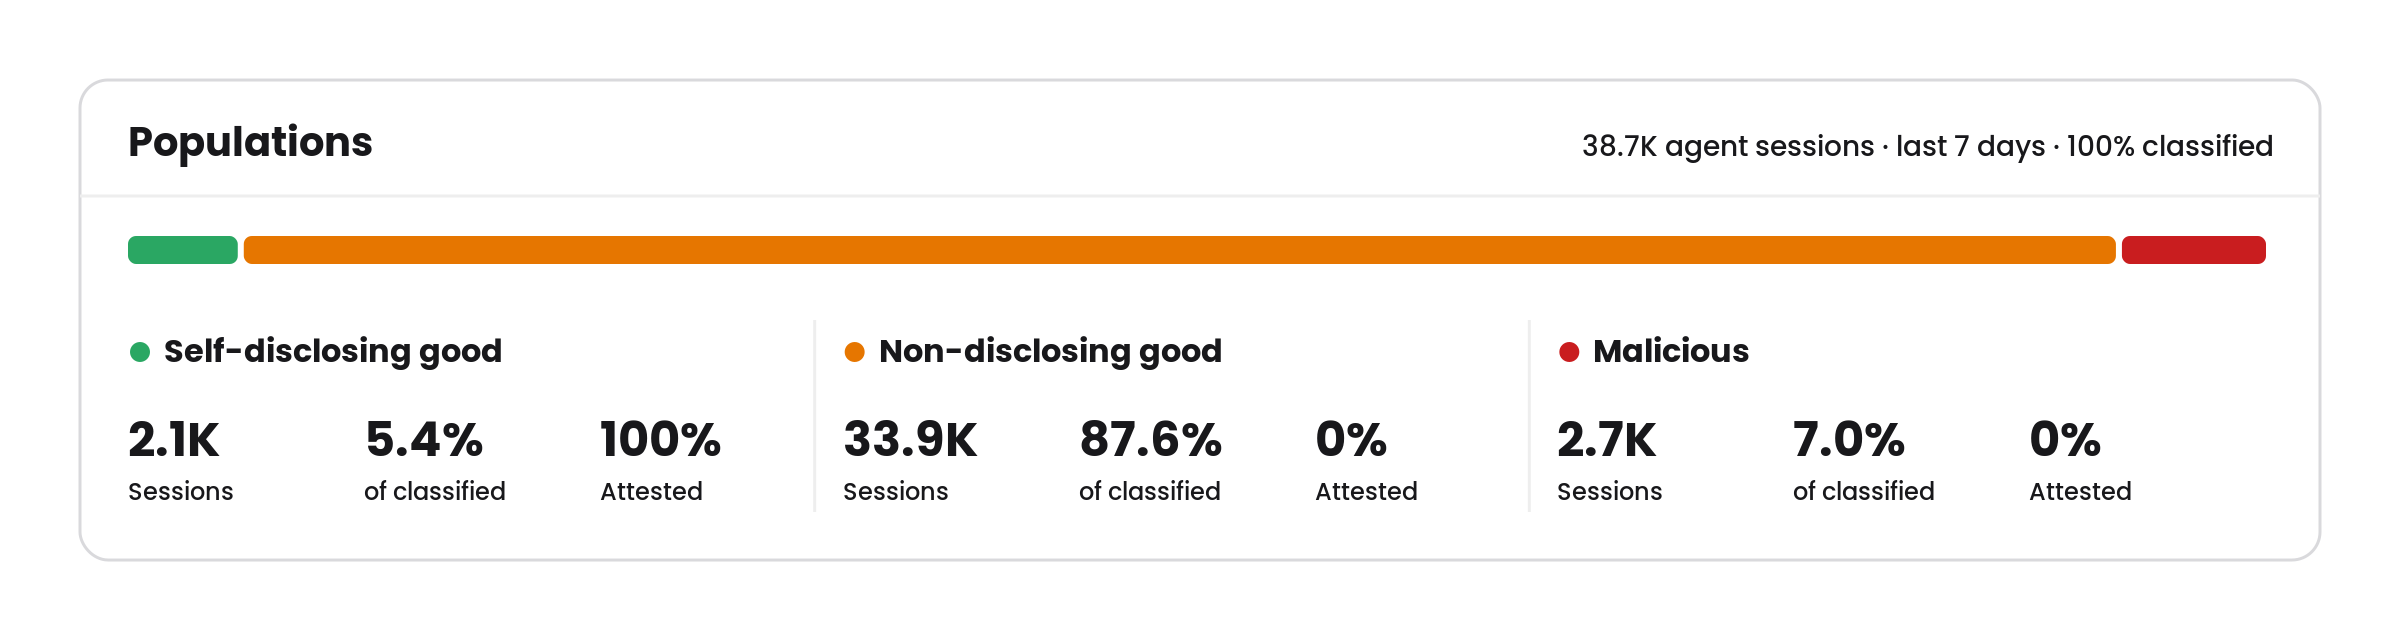
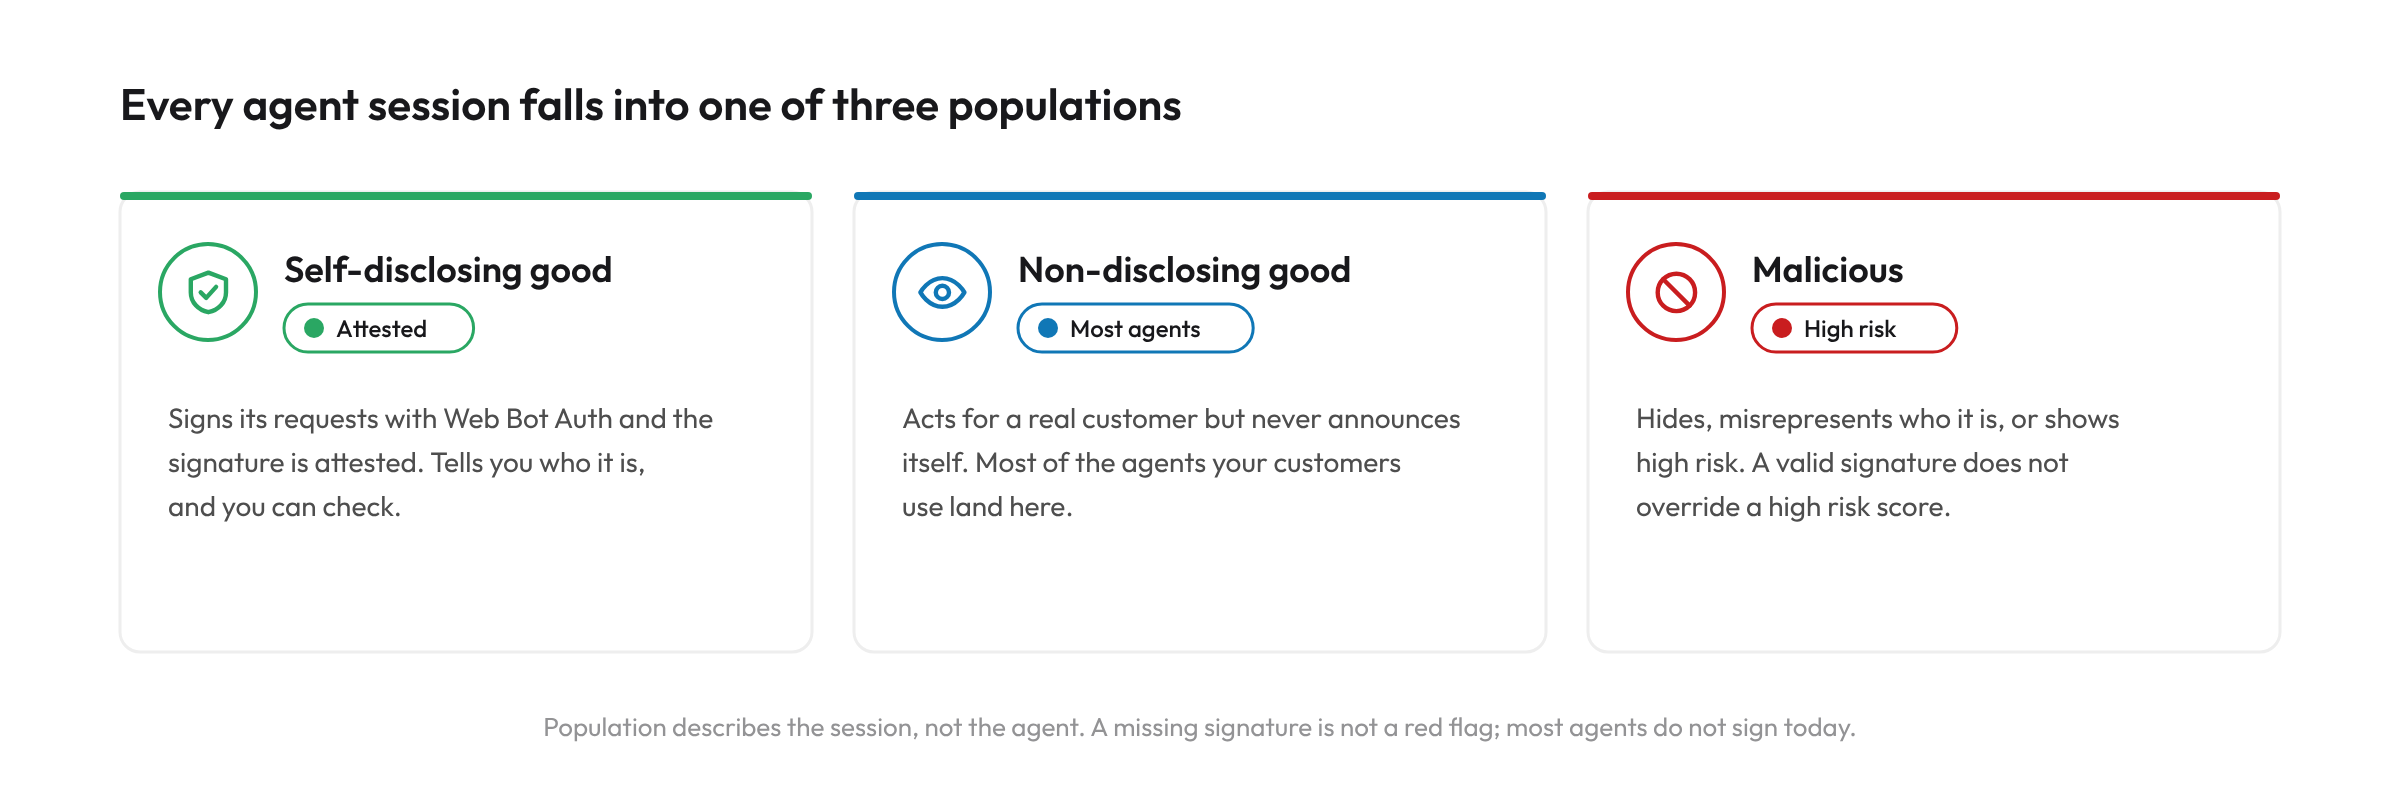
Every agent session is classified as self-disclosing good, non-disclosing good or malicious. The Agent Trust Manager dashboard shows which agents are on each key, how much traffic they drive, which are attested, how your traffic splits across the three populations, and every session behind the numbers.
Population Mix
The split across the three populations, on your dashboard and on any shared Studio dashboard.
Top Identities
The named agents on your keys, ranked by traffic, with a per-agent panel and a Titan Insight summary.
Agent ID
One handle per agent across sessions, accounts and networks. See the same agent when its network rotates, when a new build ships, and across every account it touches.
Session Explorer
Filter and export by population. Row-level detail on every session, with saved queries, and a rule created straight from the filters you are looking at.
Population describes the session, not the agent. A missing signature is not a red flag; most agents do not sign today.
What was known then, and what is known now.
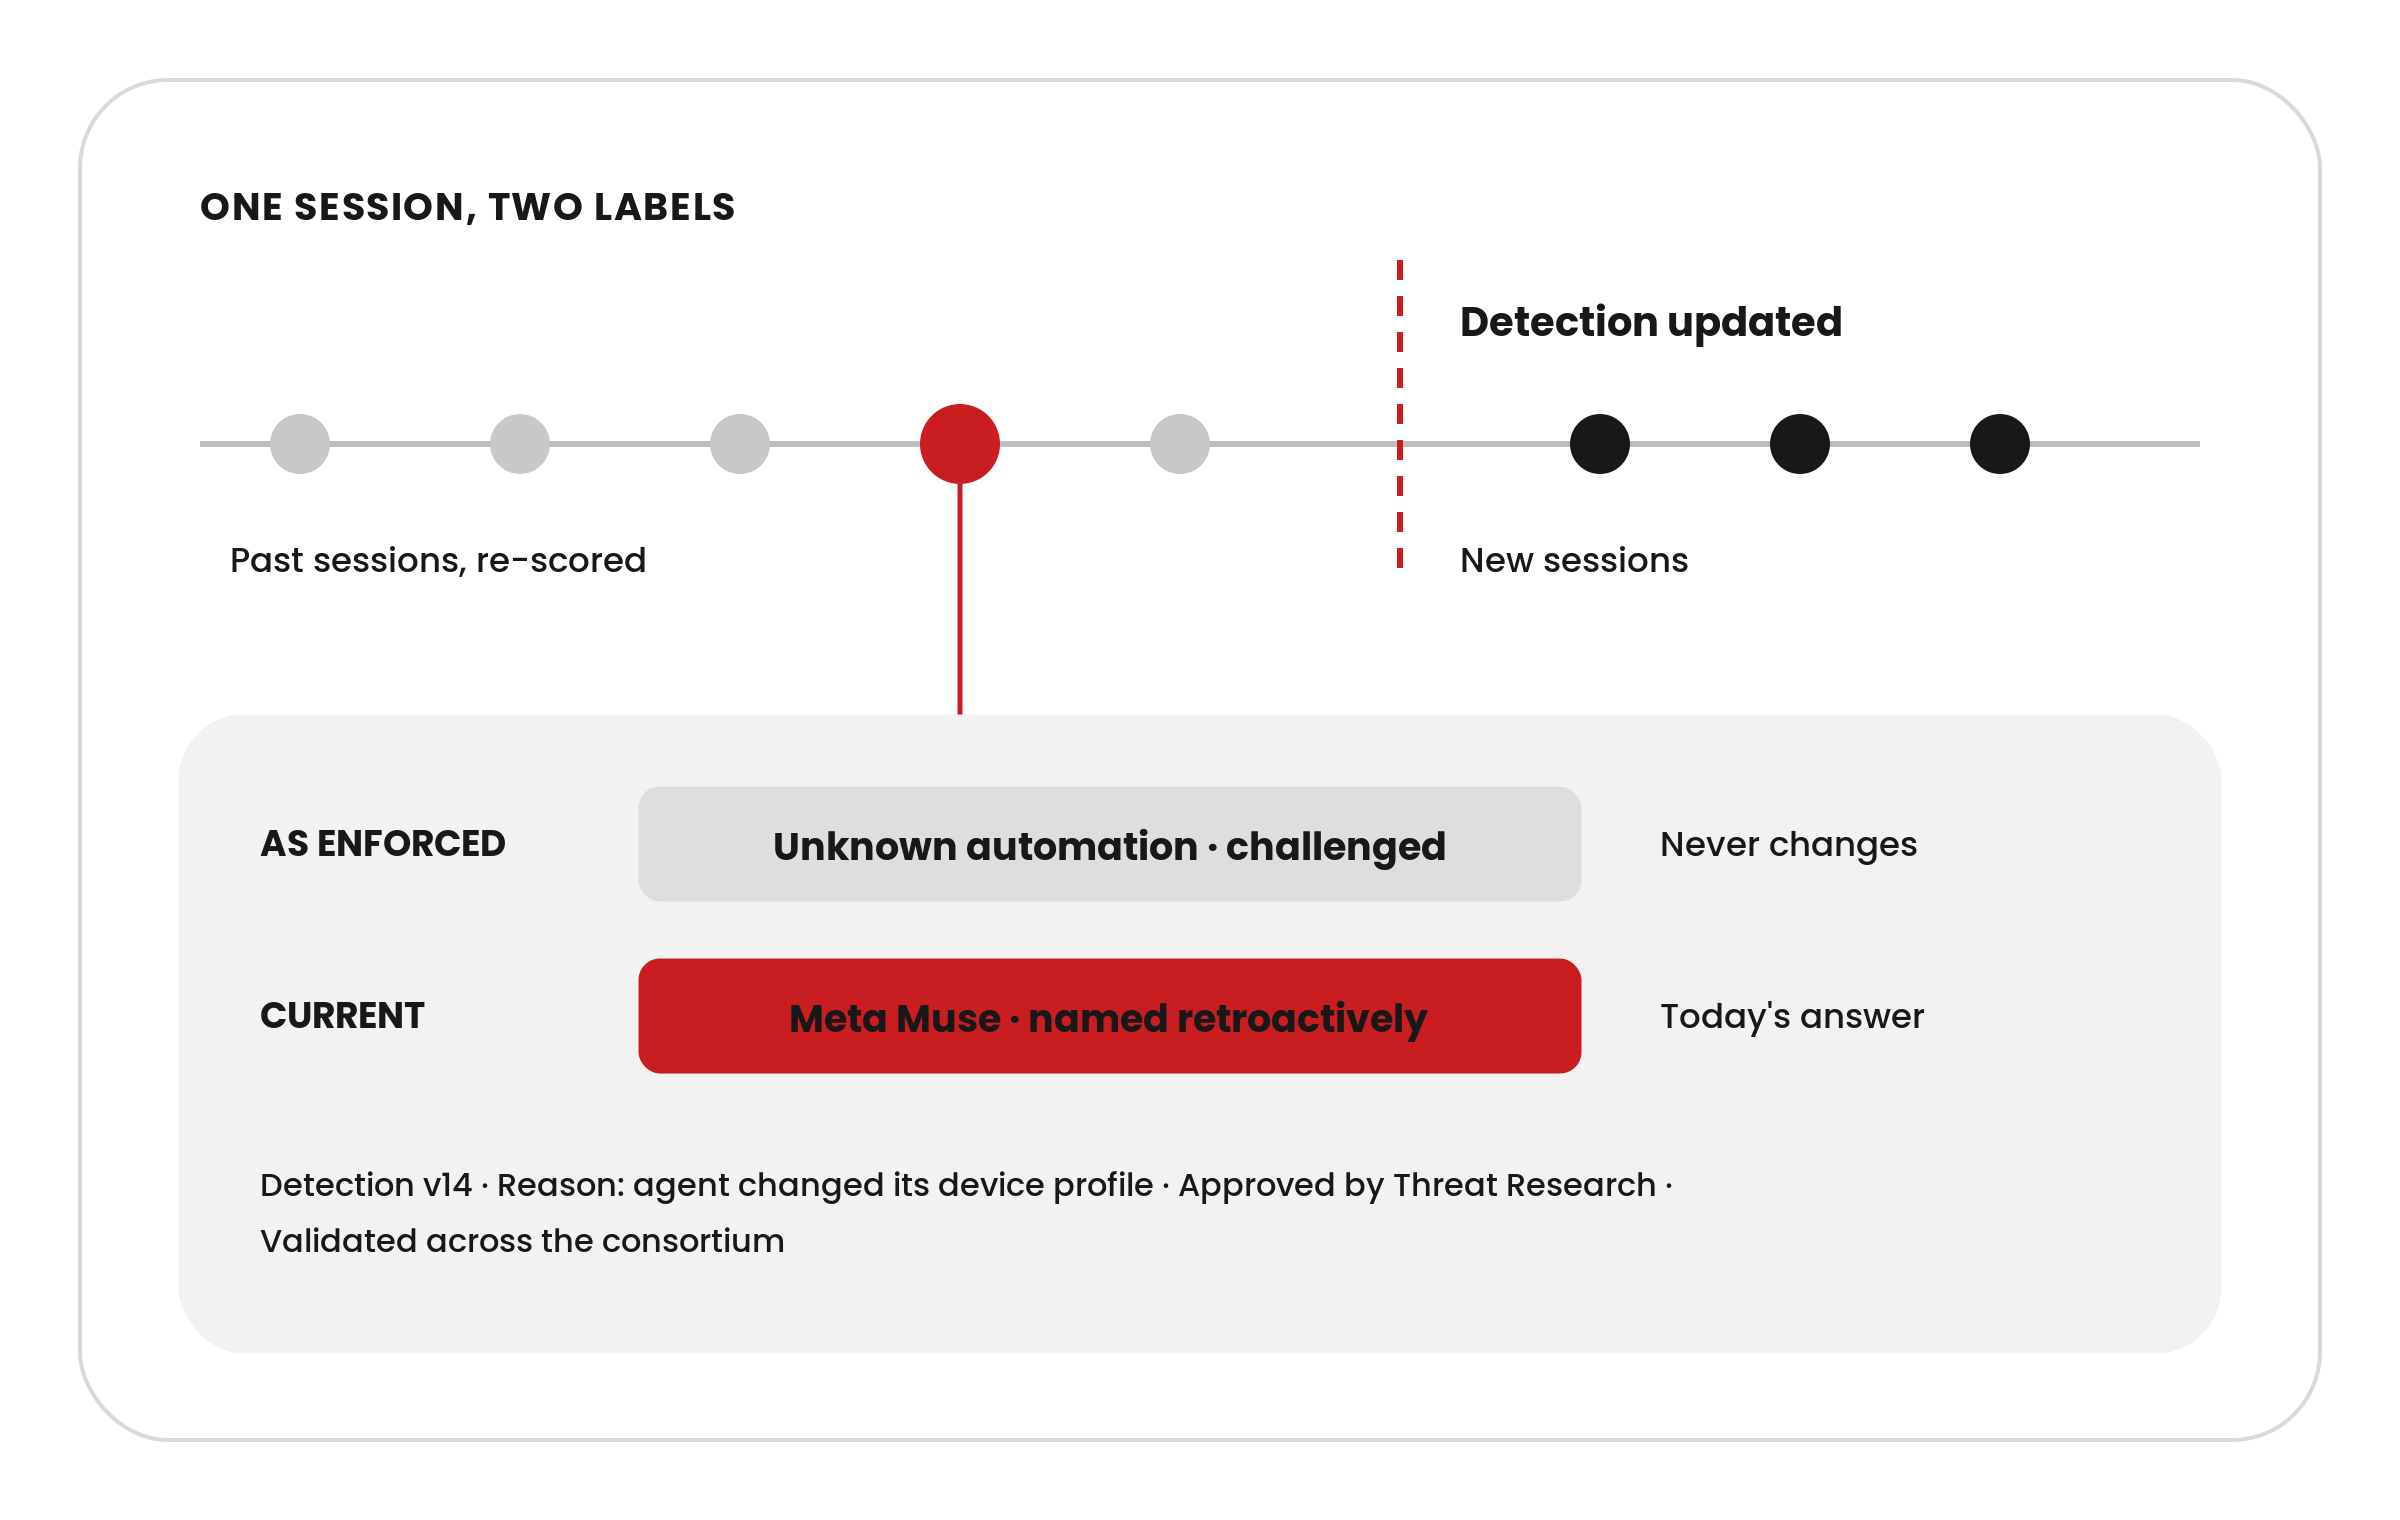
Agents change how they show up, and detection has to keep up. Detection auditing shows when our signals were updated, what each session was classified as at the time, and what a new signal would have caught when replayed across your past traffic. Open it, filter it and export it for your own records, with reclassification events available through Real-Time Logging. For a bank deciding who carries the liability for a money movement, that record is the point.
Ask, don't dig.
Plain-language answers about the agents and the risk in your traffic, in the console or in the AI assistant your team already uses. Ask Titan sits inside the Command Center with saved conversations. Arkose Command Center MCP connects the same live data to Claude, ChatGPT or any MCP client, so you can ask what is happening right now and get an answer grounded in your own account.
- No API keys and no project. An admin adds the connector once and it is live for the whole account.
- Your existing identity and roles. Everyone signs in as themselves and sees what their Arkose role already allows. Admins see and revoke every token.
- Read only by design. Teams investigate freely. Nothing can be changed through the assistant.
- Tools appear based on your entitlements: traffic and threats, Device ID, Email Intelligence, Phishing Protection, and seven Agent Trust Manager tools (KPIs, traffic over time, risk distribution, Web Bot Auth status, managed rules, per-agent sessions and per-agent trend). The assistant and the console use the same classification, so they agree.
The rest of the console.
Telltale Explorer
A searchable catalog of every detection signal running on your account, with today-versus-baseline comparison and side-by-side signal performance.
Dashboard Studio
Build the view your team needs from a library of 46 ready-made widgets, then export to PNG, SVG or PDF for the people who never log in.
Global Intel
Network-wide agentic traffic mix over time, attack campaigns, origin countries and targets, so you can see how your traffic compares with the market.
Rules
Customer Managed Rules on Agent Detected, Agent Name and Agent Population. One umbrella signal catches newer agents too.
Plan & Usage
Entitlement, usage and a projected run-out date for every product, so renewals hold no surprises.
Accounts that want no AI features can run Command Center with Ask Titan and Titan Insights hidden. Everything else works the same.
Frequently asked questions
Is Command Center a separate product?
No. Arkose Titan is the product. Command Center is the console where you see what Titan detects, set the policy it applies, and show your team what happened. Every Arkose customer has it.
Who in my organization uses it?
Fraud, risk, trust and safety and security teams work in it day to day. Commerce and growth leaders use it to see where agents bring revenue and set the policy for those flows. Dashboard Studio exports are for the people who never log in.
Can I ask the assistant about agent populations?
Population is on the dashboard, in Session Explorer, in Rules and in Orchestrate today. Through the MCP connector you can ask about KPIs, traffic, risk, Web Bot Auth status, rules and per-agent activity; population is not yet available through the assistant.
Can the assistant change anything?
No. The connector is read only, governed by your existing roles, and admins see and can revoke every token.
See it on your own traffic.
If you are already an Arkose customer, you are already seeing agentic traffic in your Command Center. If you are not, book a Titan demo and we will show you the agents in your flows today.
